


What is the state of poverty in the U.S.? Take this quiz to find out.
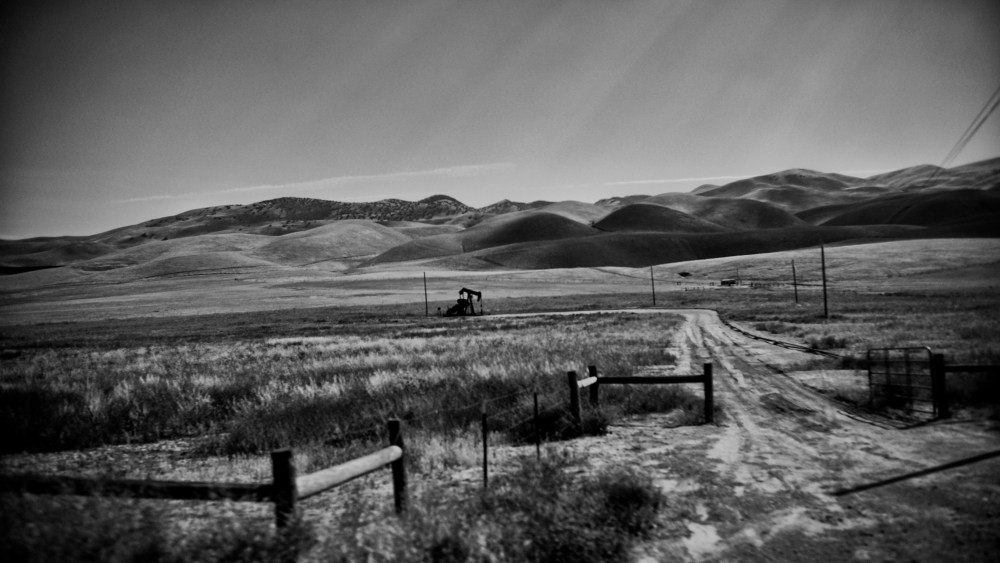
Related: Geography of Poverty: A journey through forgotten America
There are two different versions of the federal poverty measure: the poverty guidelines and the poverty thresholds. The thresholds are statistical: they make it possible to calculate how many people are in poverty. The guidelines are administrative: they make it possible to determine an individual’s financial eligibility for certain programs and provisions. They both change annually.
Some people suspect that the actual poverty rate is much higher than the official rate.
The number of poor people living in the suburbs grew 53% between 2000 and 2010.
More information on these statistics.
The U.S. economy added 285,000 jobs in May 2015, but unemployment rose.
One in five US children receives food stamps.
These savings statistics tie into the fact that one in four jobs in the U.S. is considered low wage.
Check out the Geography of Poverty project
Erica Getto